Home / Portfolio / Storytelling / Special Districts 1952-2012
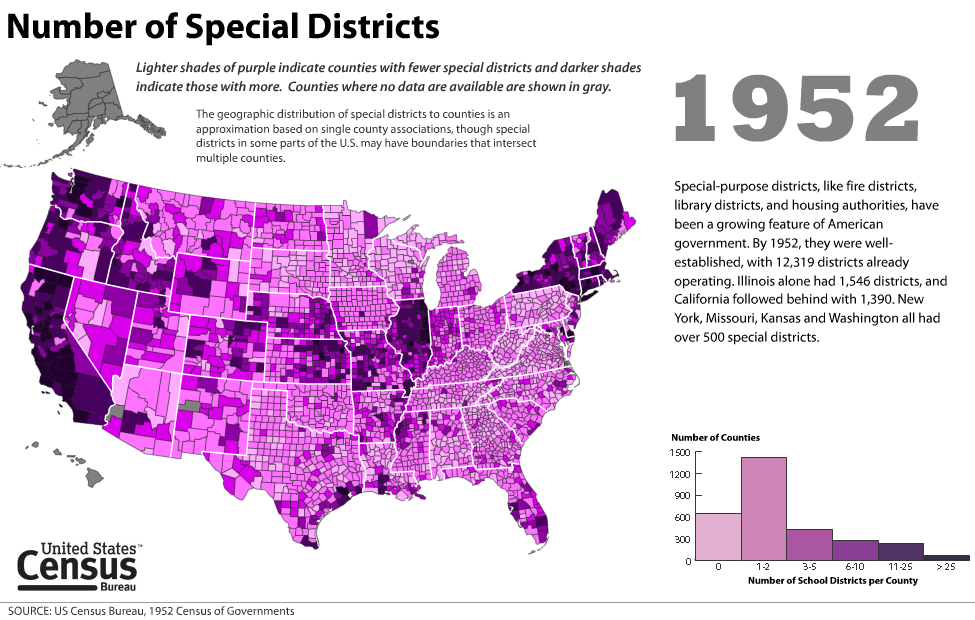
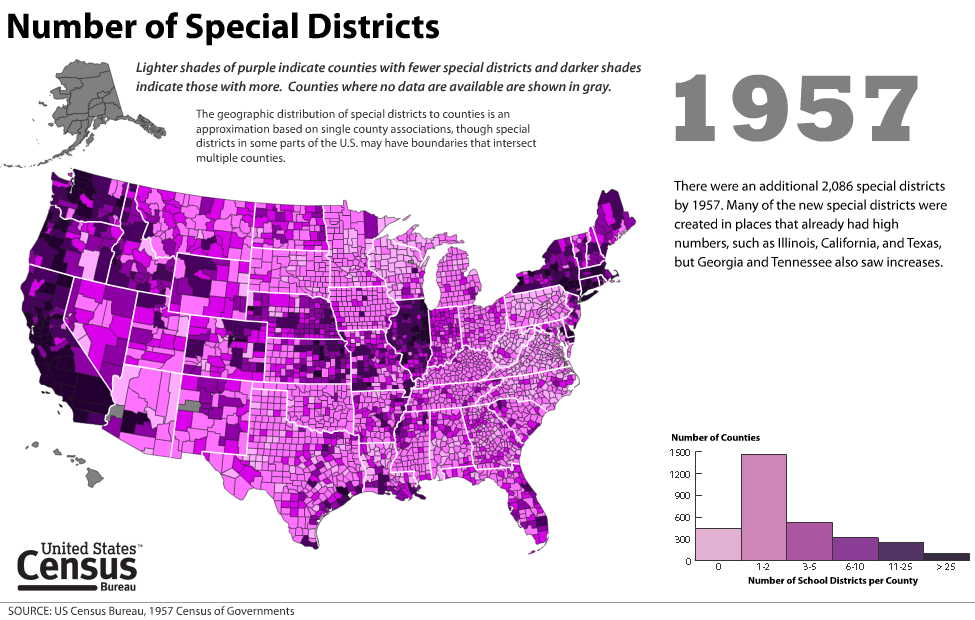
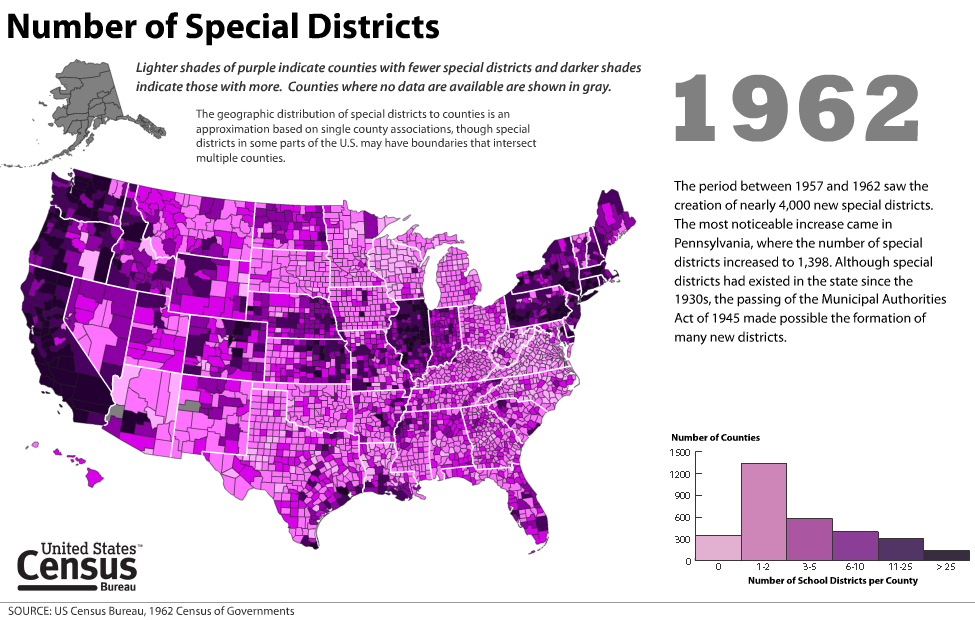
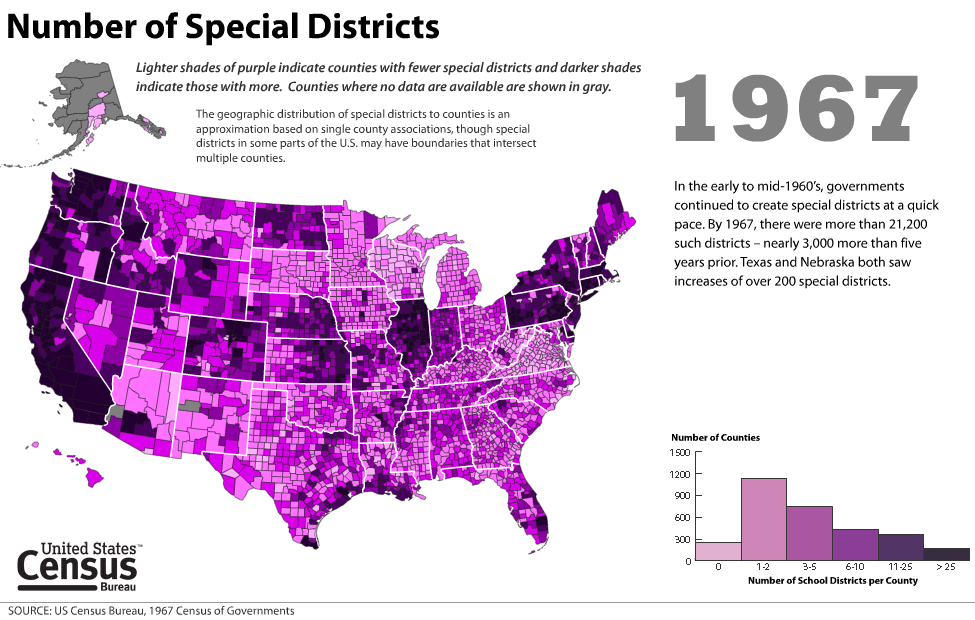
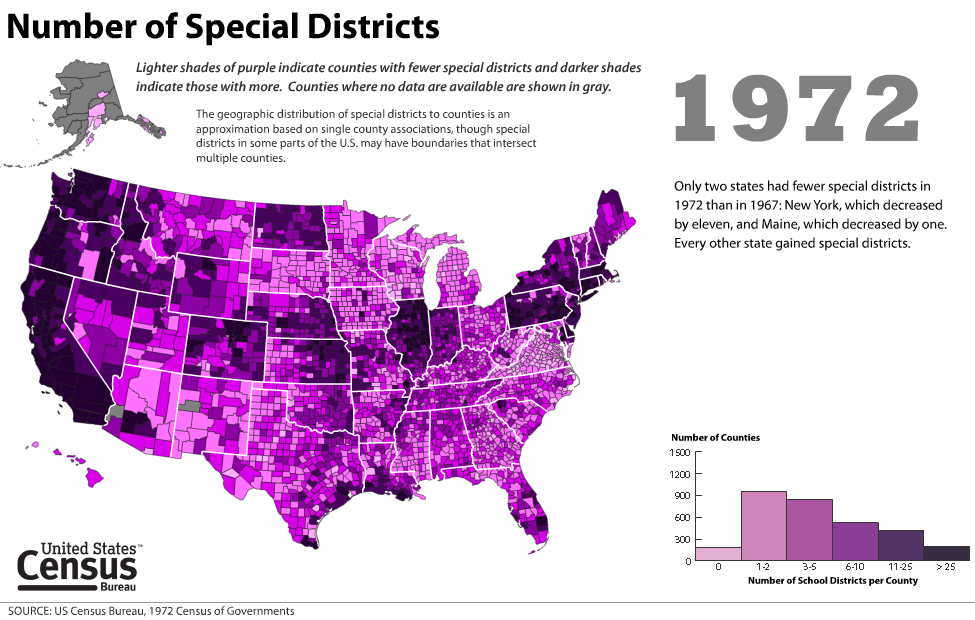
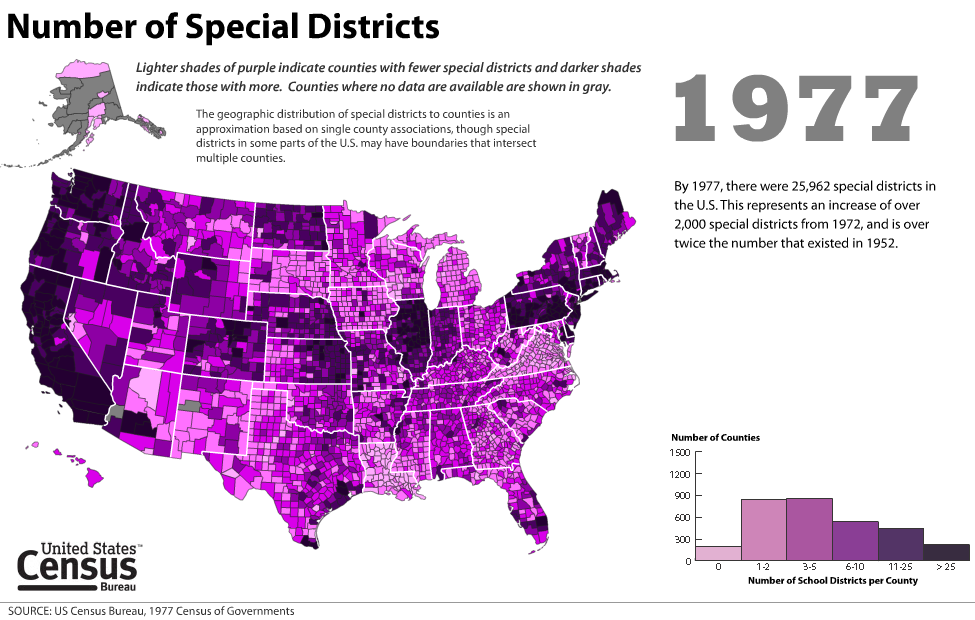
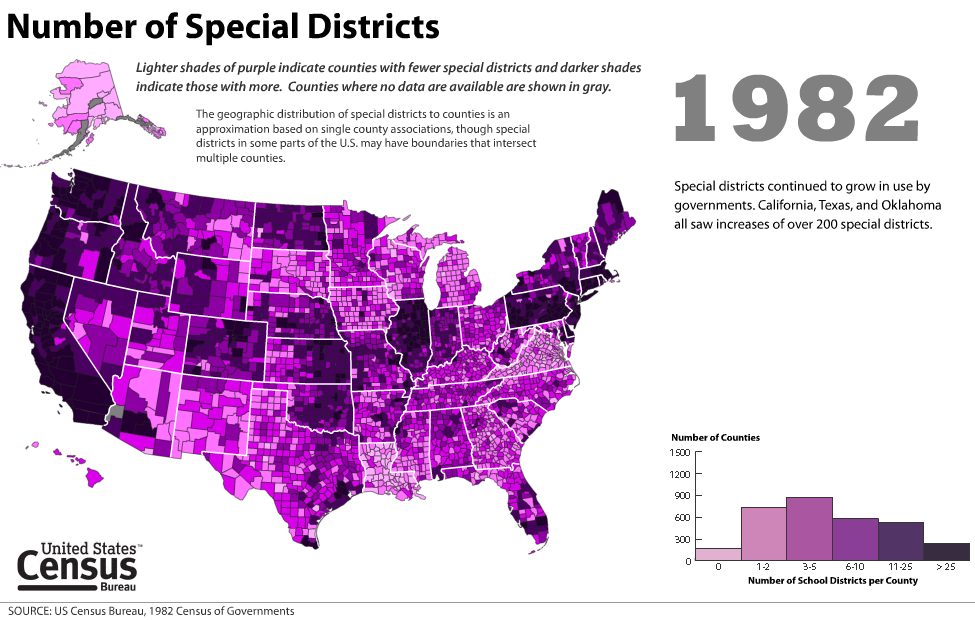
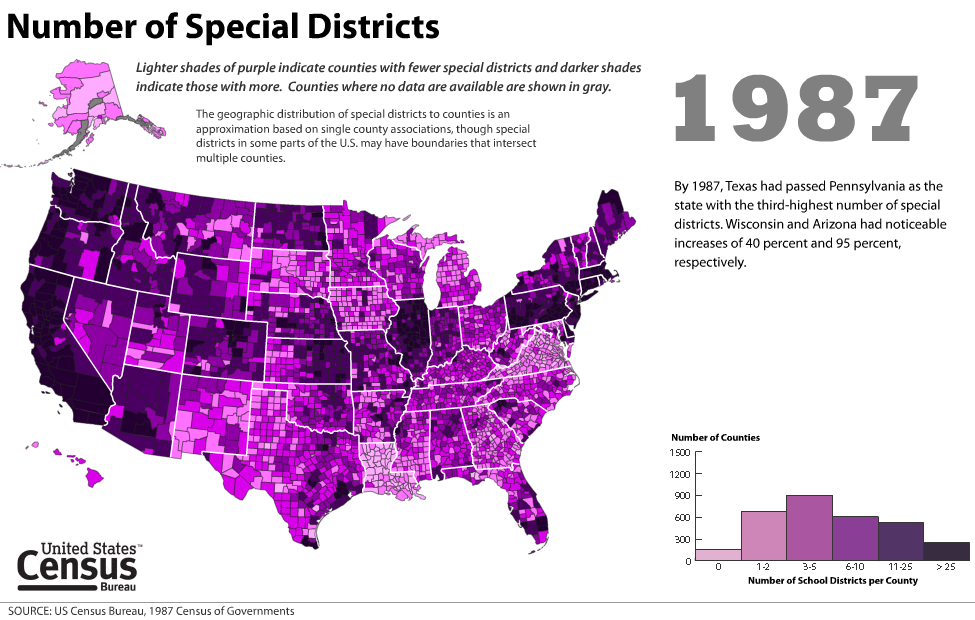
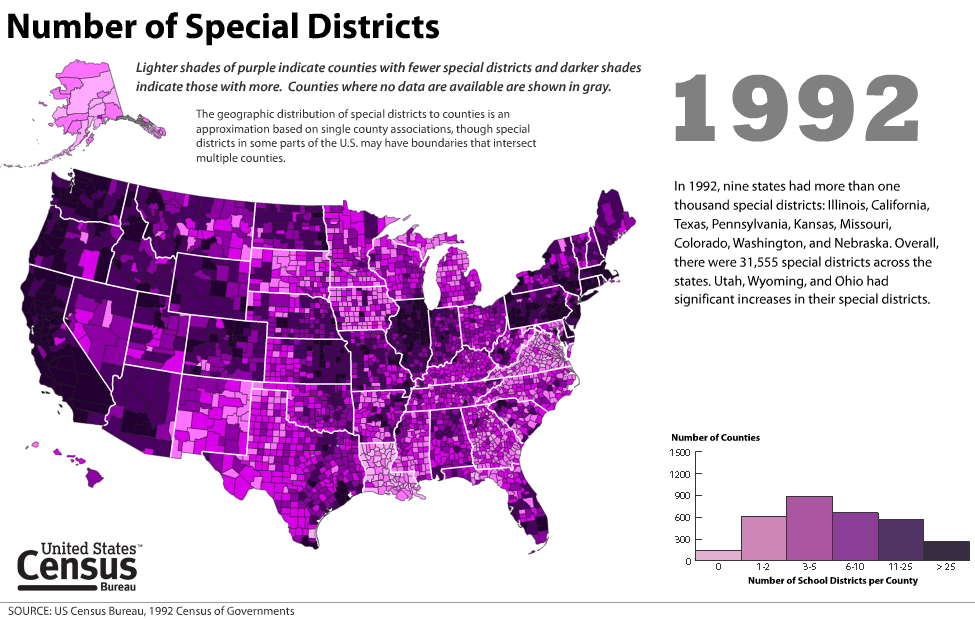
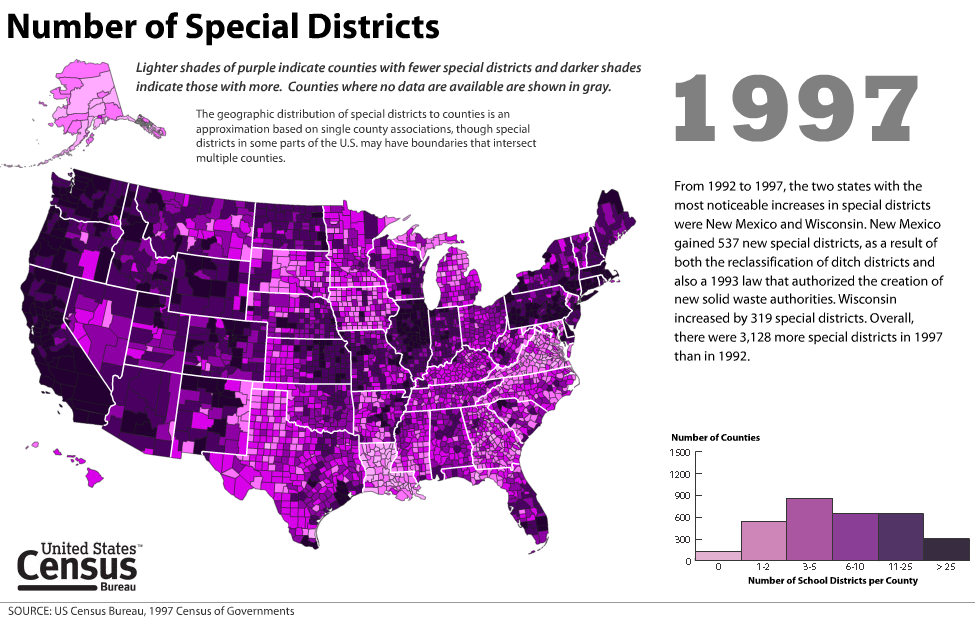
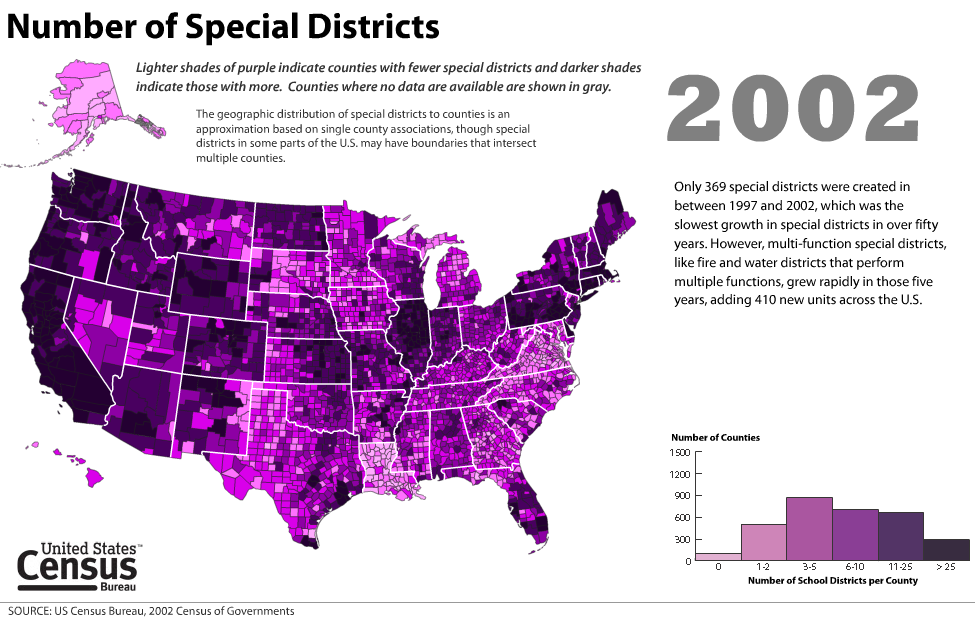
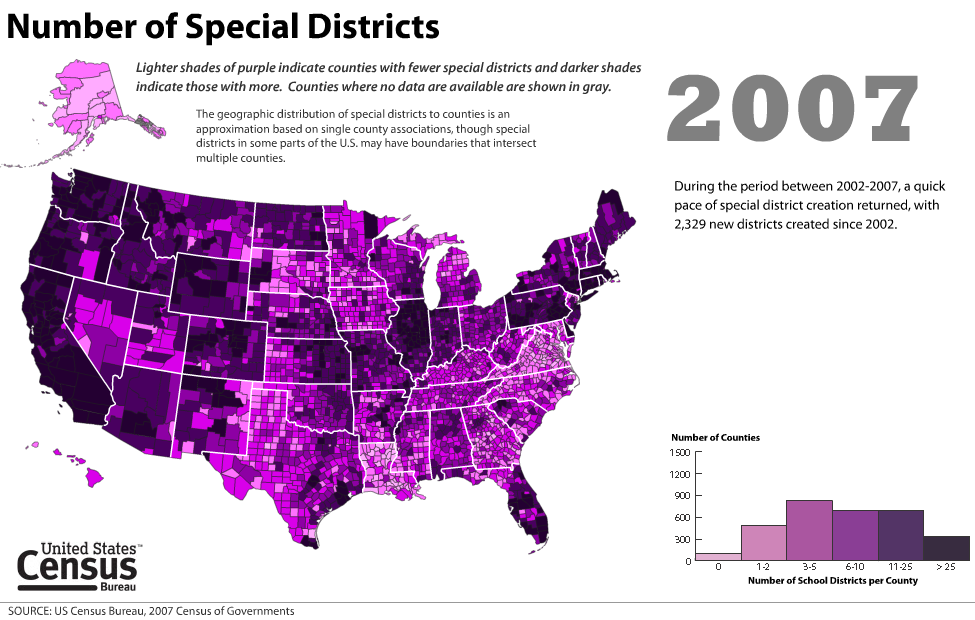
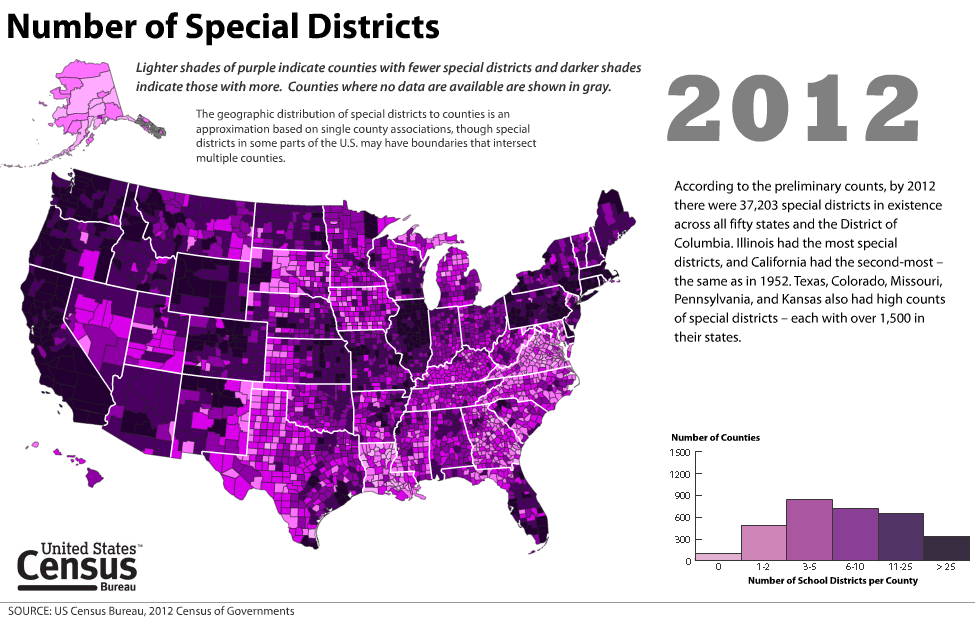
Number of Special Districts by County 1952 -2012
- R, SAS, Excel, Adobe Illustrator, SVG, HTML
This animated visualization was created to accompany a data release for the 2012 Census of Governments. Viewers will notice that the number of special districts increases over time throughout the country, particularly in California. The histogram does double duty as both a description of the distribution at a national level and a legend.

