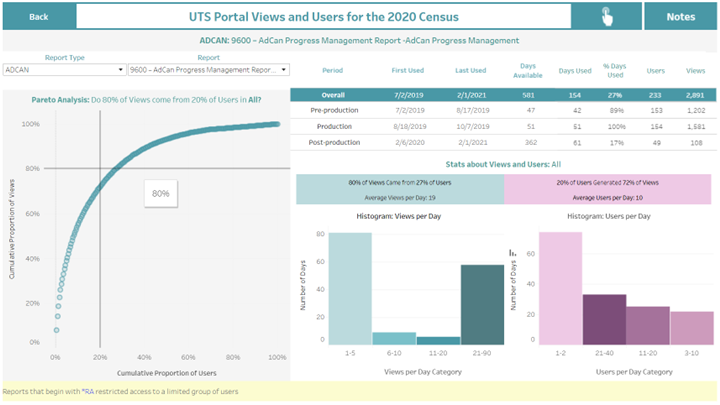
Developed a Tableau BI dashboard to show the number of users and views for reports used during the 2020 Census that were developed by an enterprise data lake system. The portal usage had 775 users that accessed 106 cost and progress reports during the 2020 Census. It included summary statistics to describe portal usage as well as advanced metrics for a Pareto-inspired chart that compared report views to users. Interactivity enabled multivariate comparisons. Insights from this dashboard informed managers on ways to streamline reporting by indicating which reports to remove and helped decision-makers determine upper limit for number of concurrent users which has a tremendous cost impact.