Home / Portfolio / Storytelling / Independent School Districts 1952-2012
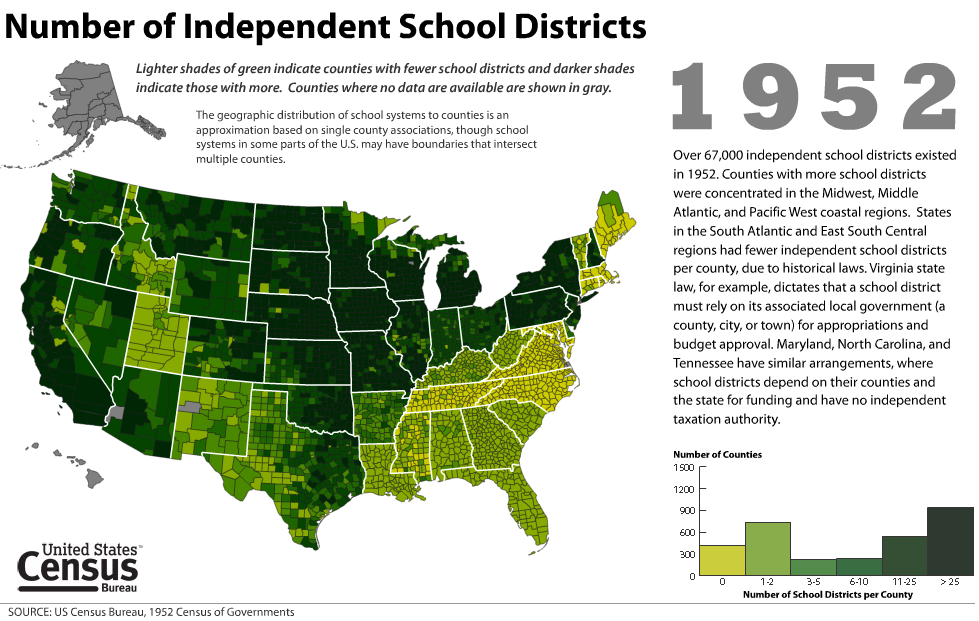
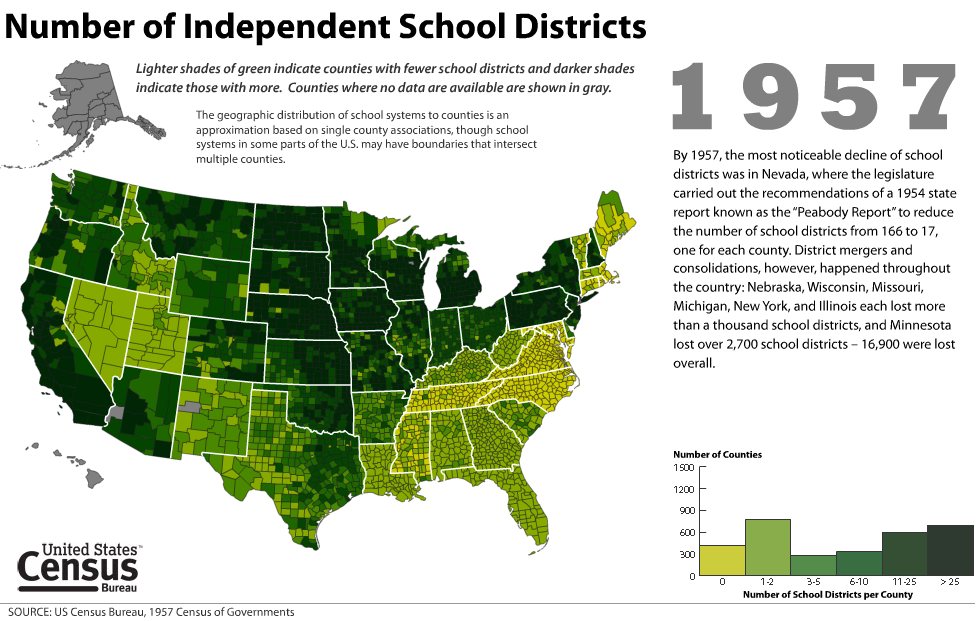
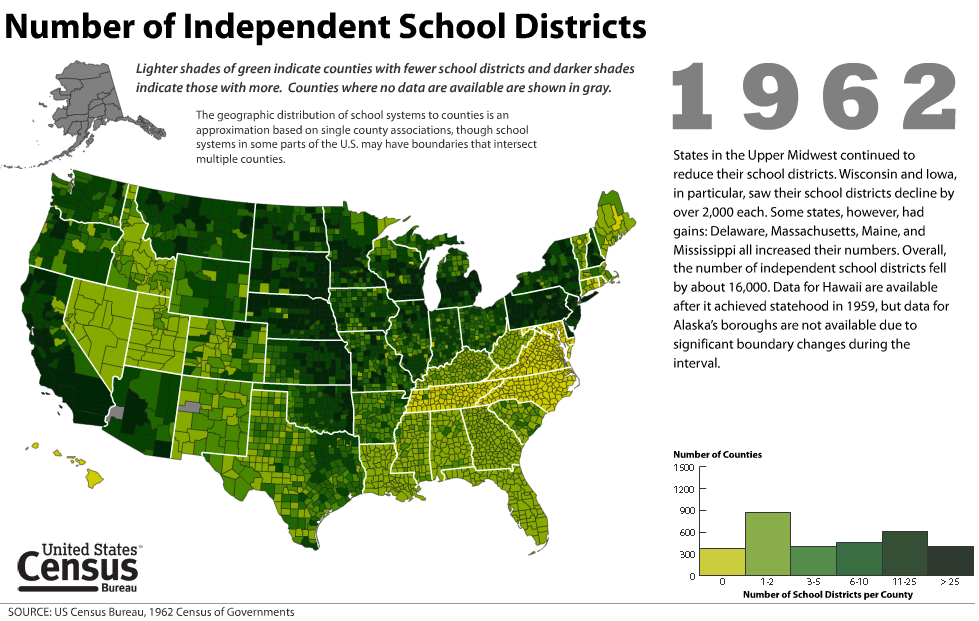
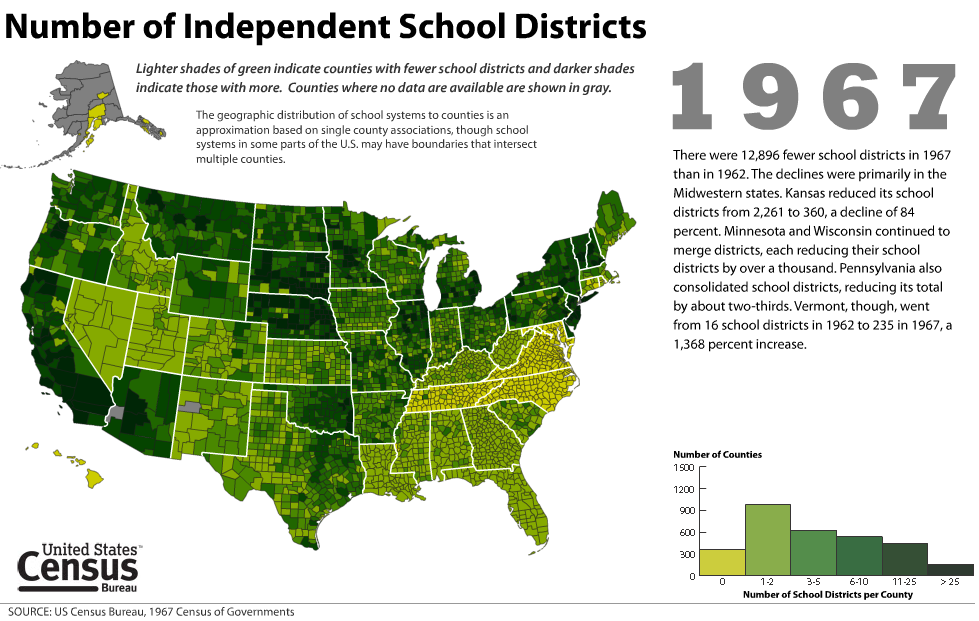
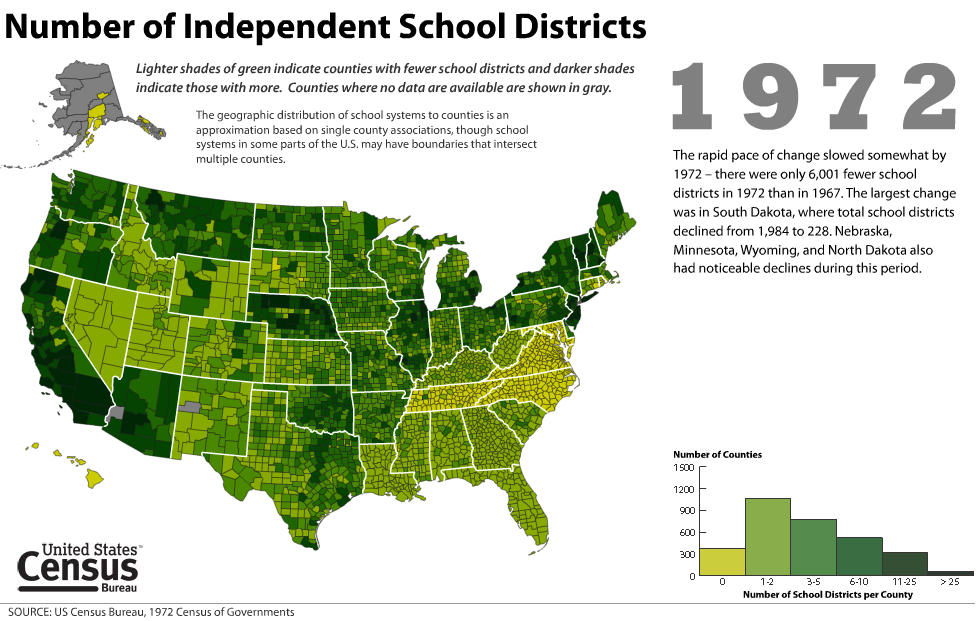
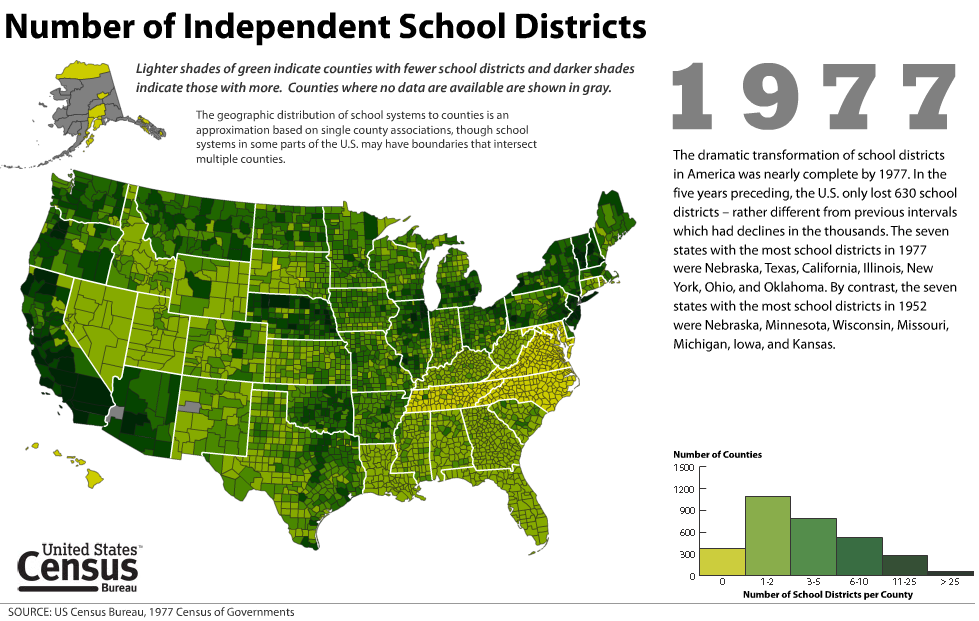
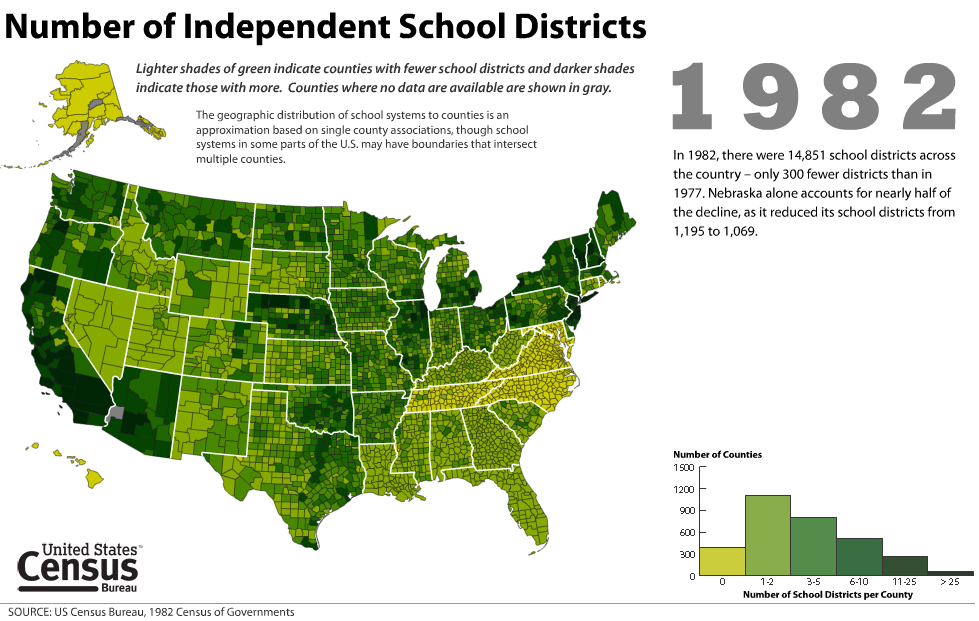
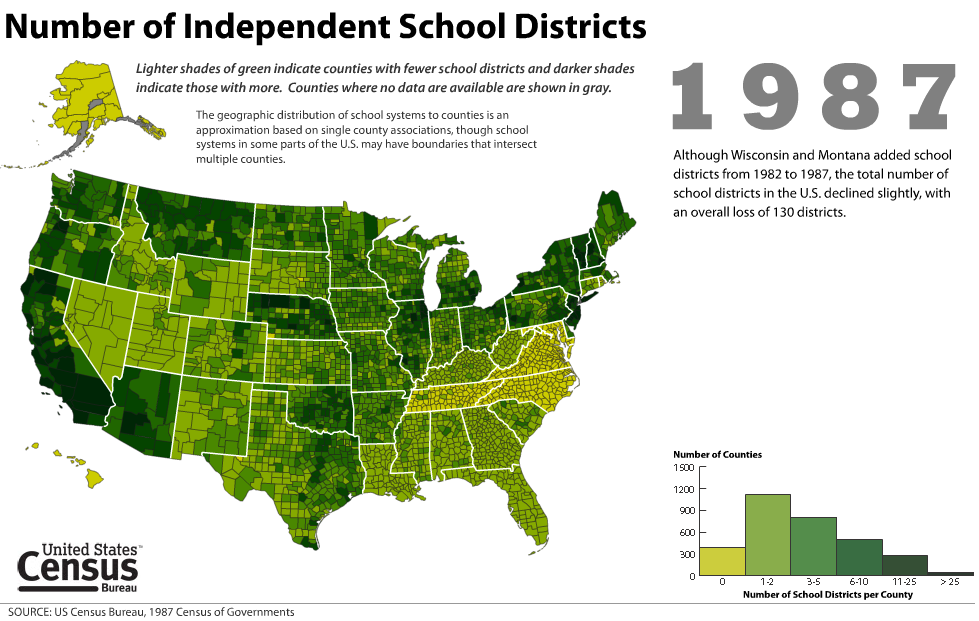
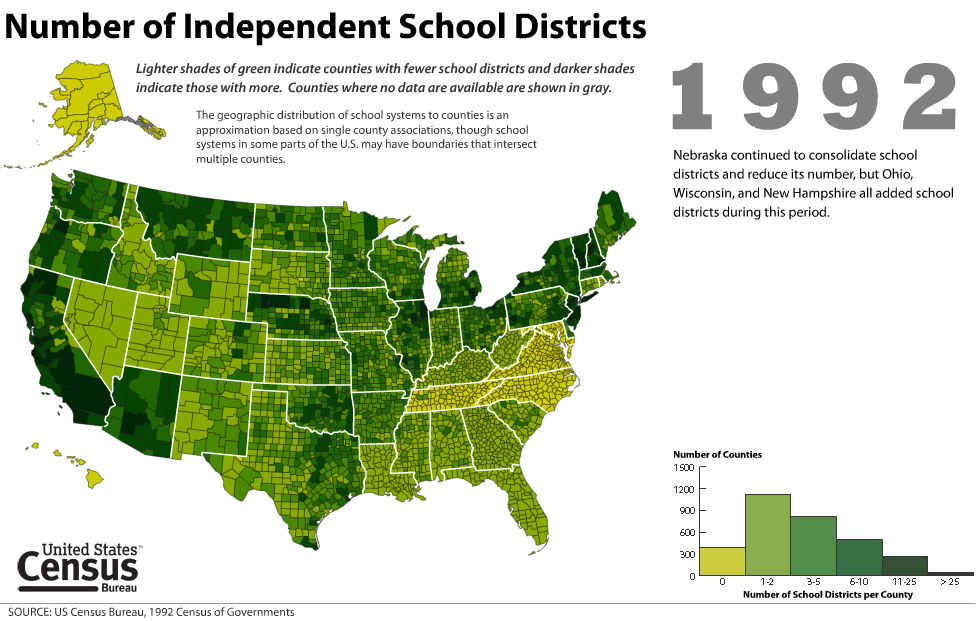
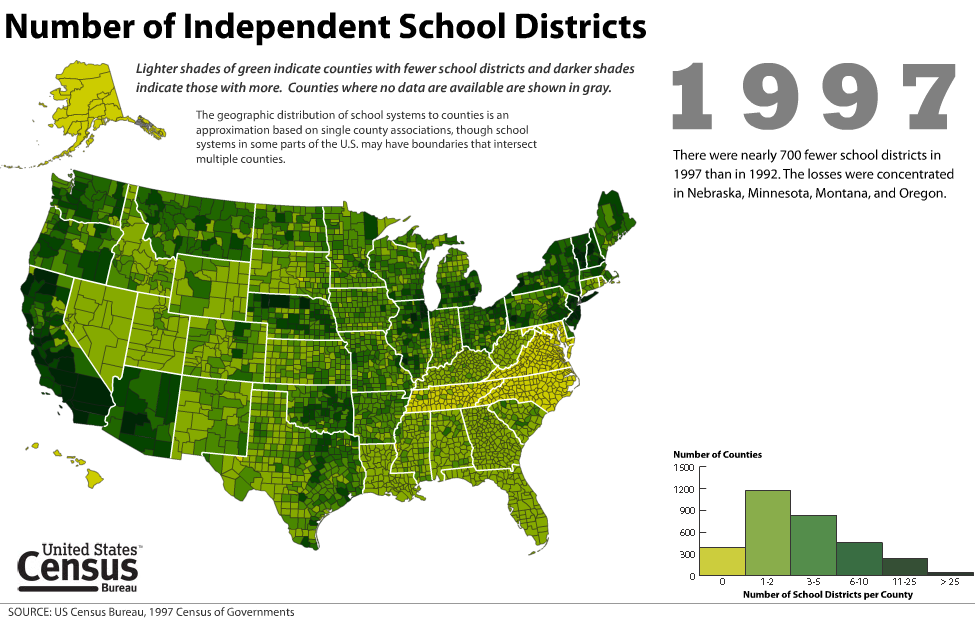
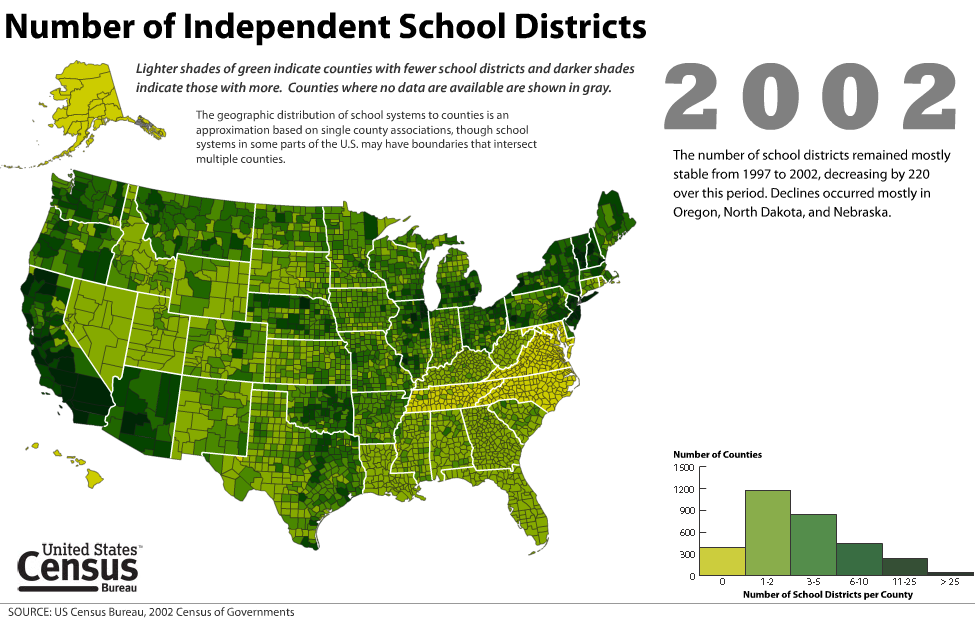
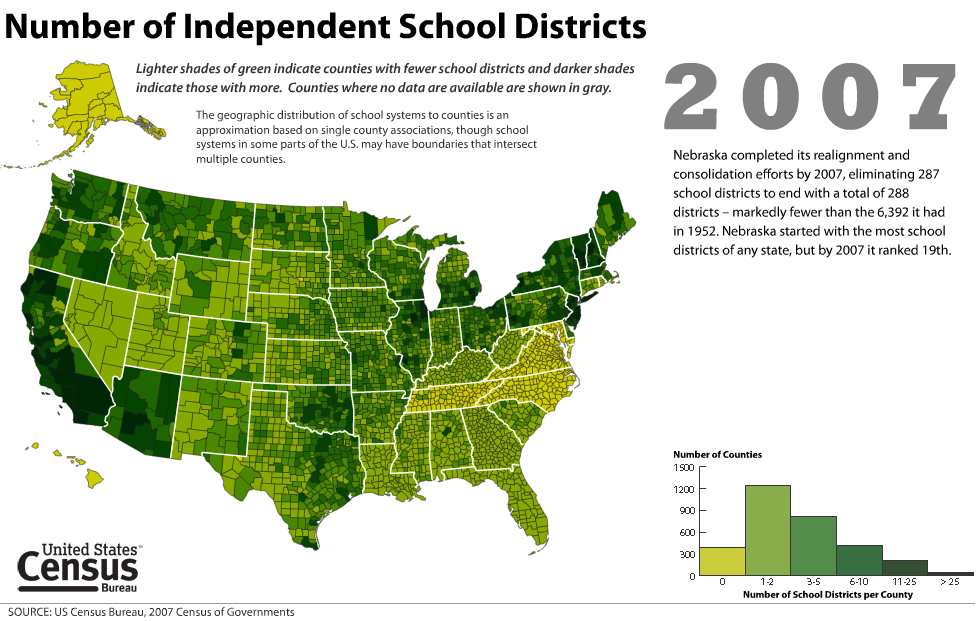
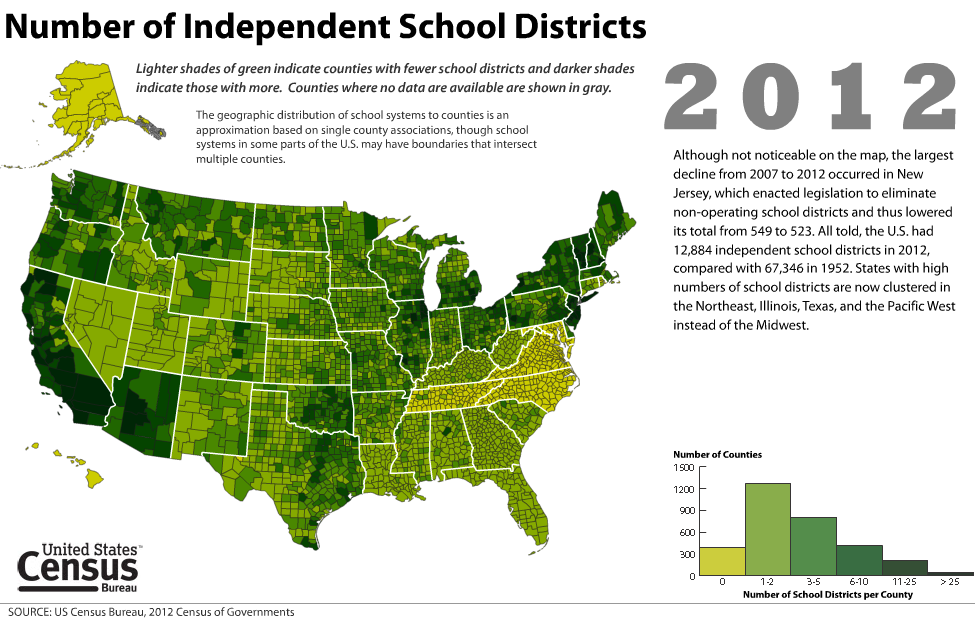
Number of Independent School Districts by County 1952 -2012
- R, SAS, Excel, Adobe Illustrator, SVG, HTML
This animated visualization was created to accompany a data release for the 2012 Census of Governments. Viewers will notice the Midwest have fewer independent school districts as we go from 1952 to 2012. The histogram serves a dual purpose as both a description of the distribution at the national level and a legend.

